Spatial Analysis Python Project
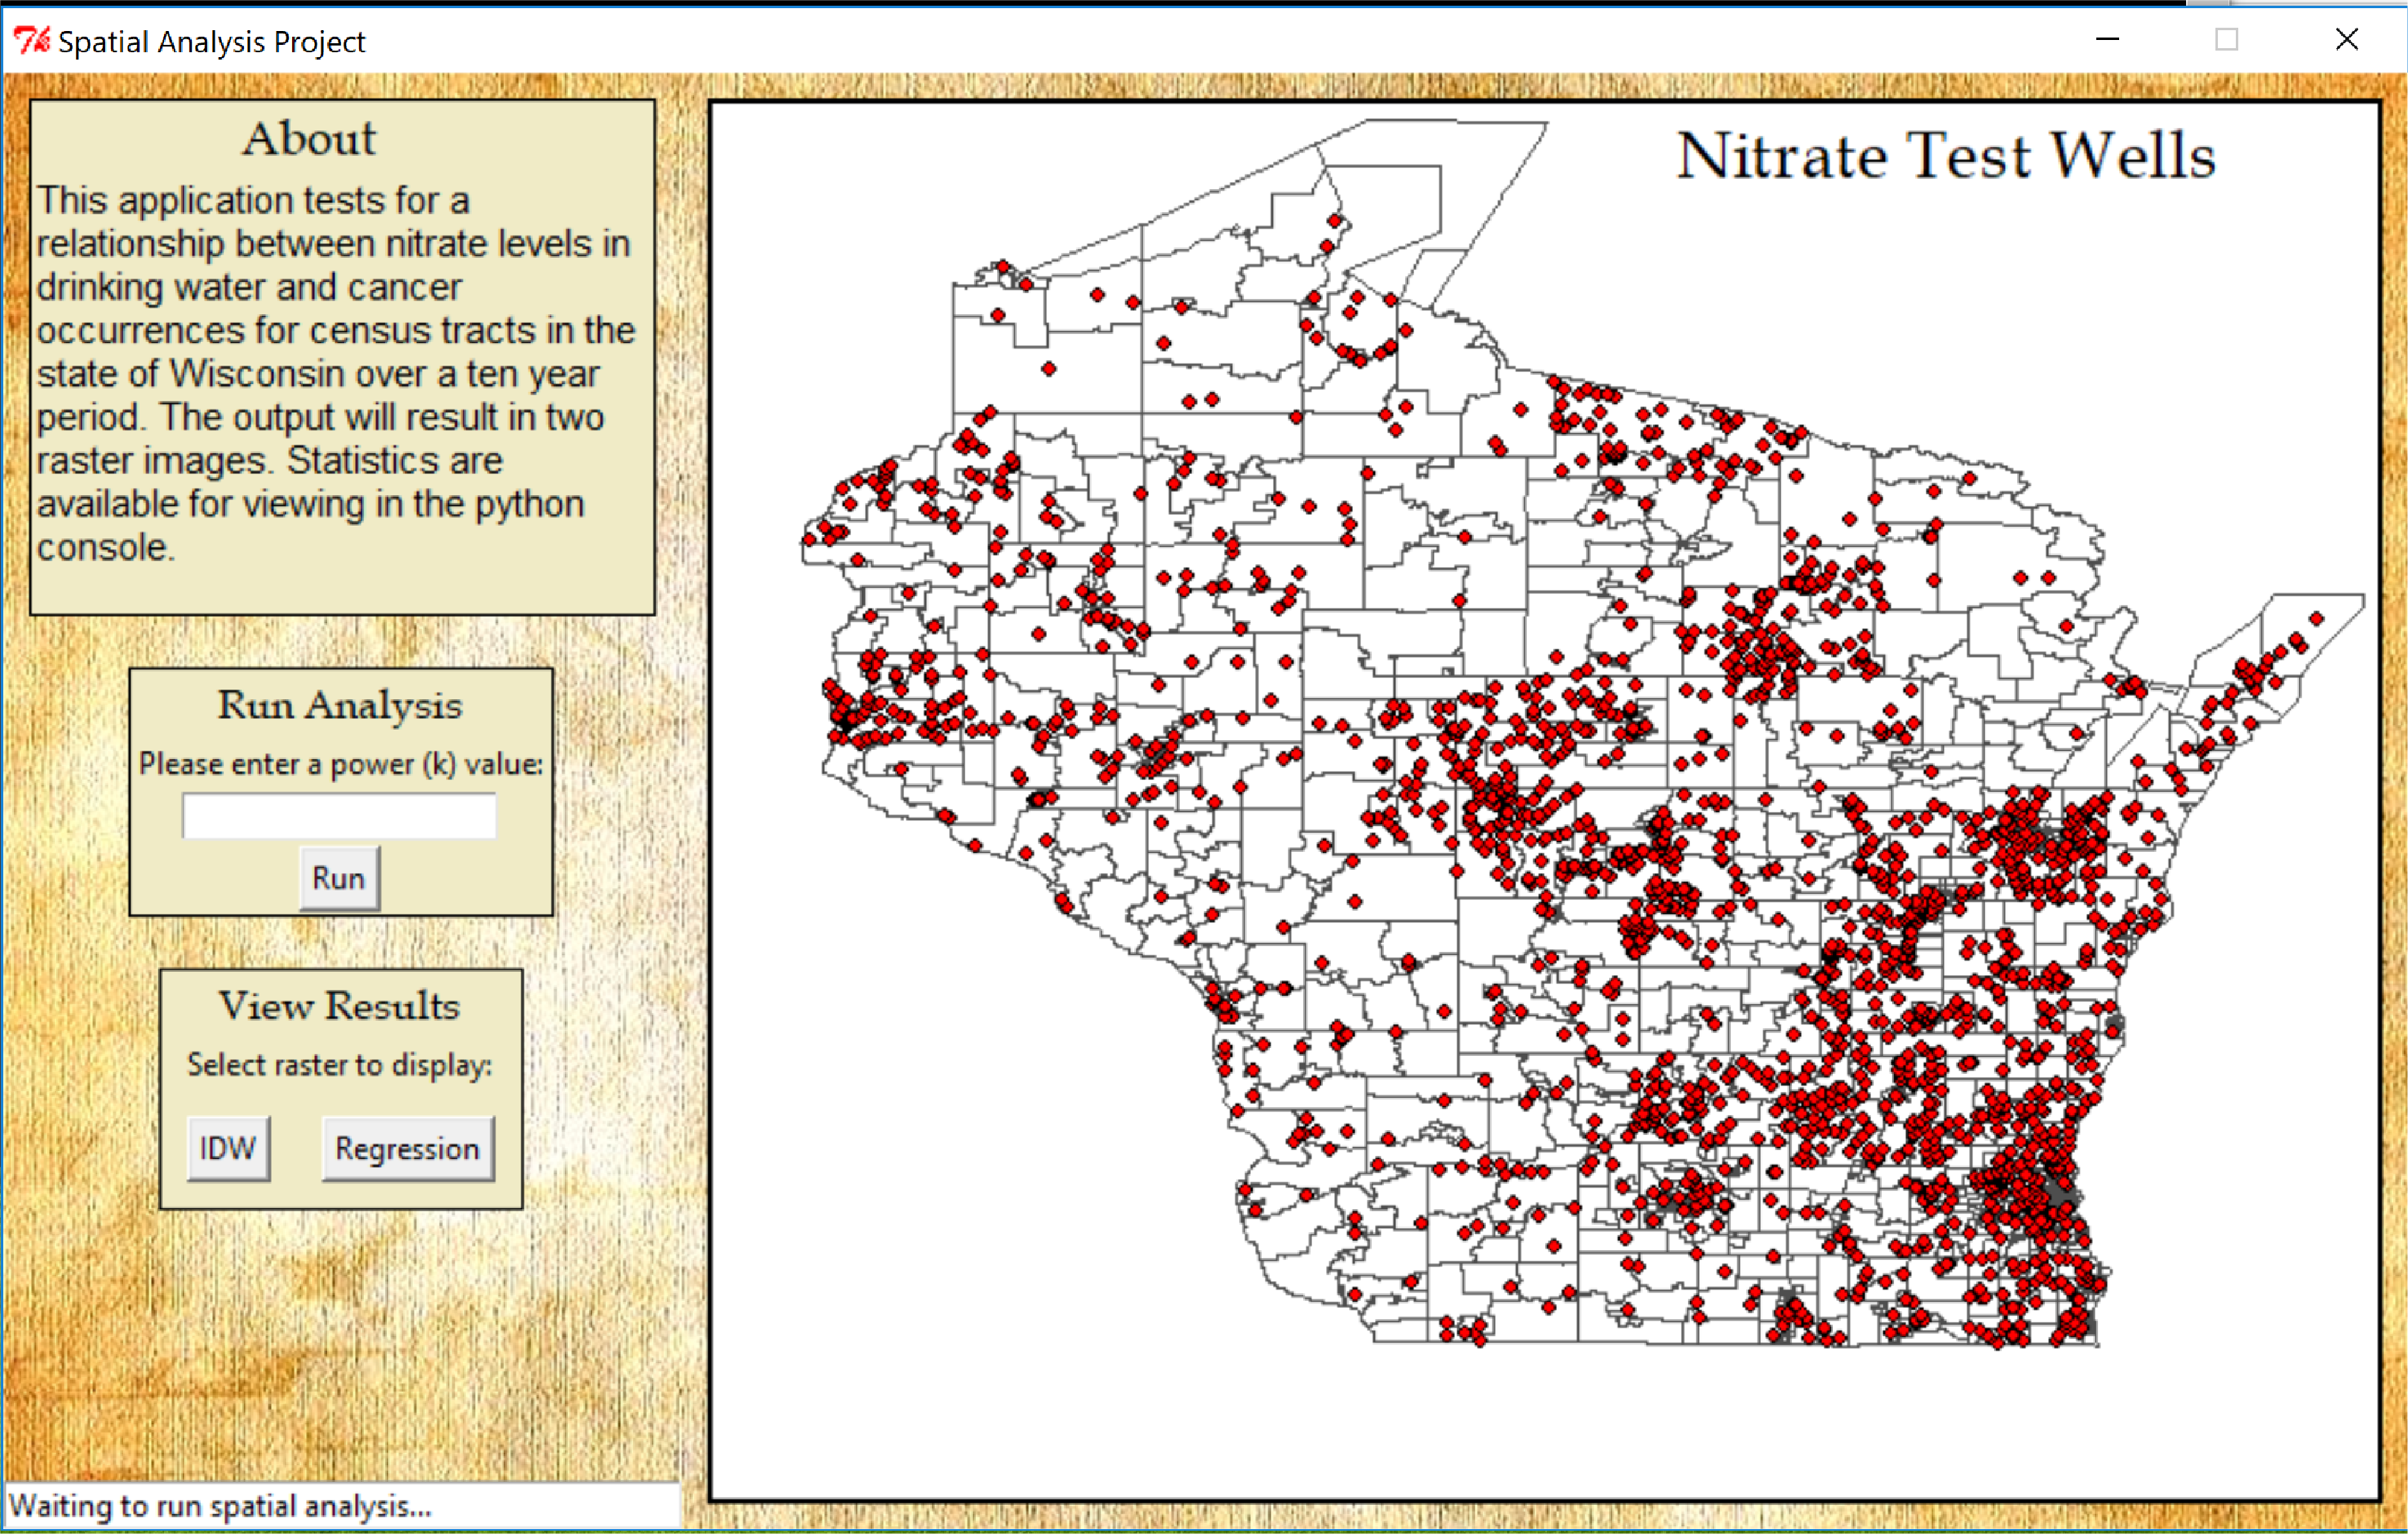
When there are high concentrations of nitrate in drinking water it is known to be a potential health hazard. Recently, there has been suspicion that nitrate is linked to cancer in adults but the degree of the risk is not yet known. This project will explore a potential relationship between nitrate levels in drinking water and cancer occurrences over a 10-year period in the state of Wisconsin. There are two datasets for this project, a dataset of randomly sampled well locations with nitrate levels and cancer rates per census tract in Wisconsin. Click Here to view or download the Github repository!
To assist with the process of finding a relationship between nitrate levels and cancer a Python script was prepared to run various ArcPy functions. A graphical user interface with Tkinter was also developed to run the script and to visualize the results. The first step was to create an image showing the distribution of nitrate over the entire surface of Wisconsin. This process can be achieved using interpolation. Interpolation predicts values where there is no data for locations from a limited set of sample points. Interpolation is basically guessing values between points where the values are already known. In this case, the surface image was generated from a set of well water sample points throughout Wisconsin. The task was accomplished by using the Inverse Weighted Distance (IDW) function in ArcPy. IDW interpolation allows the user to choose something called the distance decay coefficient (power value), which determines how fast weight will decrease as distance increases. In other words a higher power value will result in more emphasis being put on the nearest points than the farthest points. The points that are the closest will have more influence and the surface will have more detail. A power value of 1.50 was used for a smoother surface, the default for the script is 2.0. Having too high of a power value (over 30) may negatively impact the results. Once IDW is ran the script will output a raster map showing nitrate levels across most of the state. The next step was to aggregate the data from the nitrate surface to the Wisconsin census tracts. The water nitrate data and the census tracts need to be in the same spatial units to perform regression analysis. This was accomplished using the Zonal Statistics as Table function in ArcPy. Zonal statistics basically calculates statistics on the values of a raster within the zones of another dataset. Basically, we are using this to get the average nitrate values for each census tract in Wisconsin. The next step is to join the existing census tracts table to the new table from the zonal statistics. The cancer rate for each census tract has already been determined, so now we have both the cancer rate and the average nitrate values for each census tract. Now that we have the data in the same spatial units, the final step in this process is to run linear regression on the cancer and nitrate data to determine if there is a relationship between them. With regression we can try and demonstrate the degree that one or more variables might promote a positive or negative change in another variable. The type of regression that was used here is the Ordinary Least Squares (OLS) regression ArcPy function. The cancer rate was the dependent variable and the average nitrate values was the explanatory variable. The function will produce a static map and output statistics showing how well our model performed.
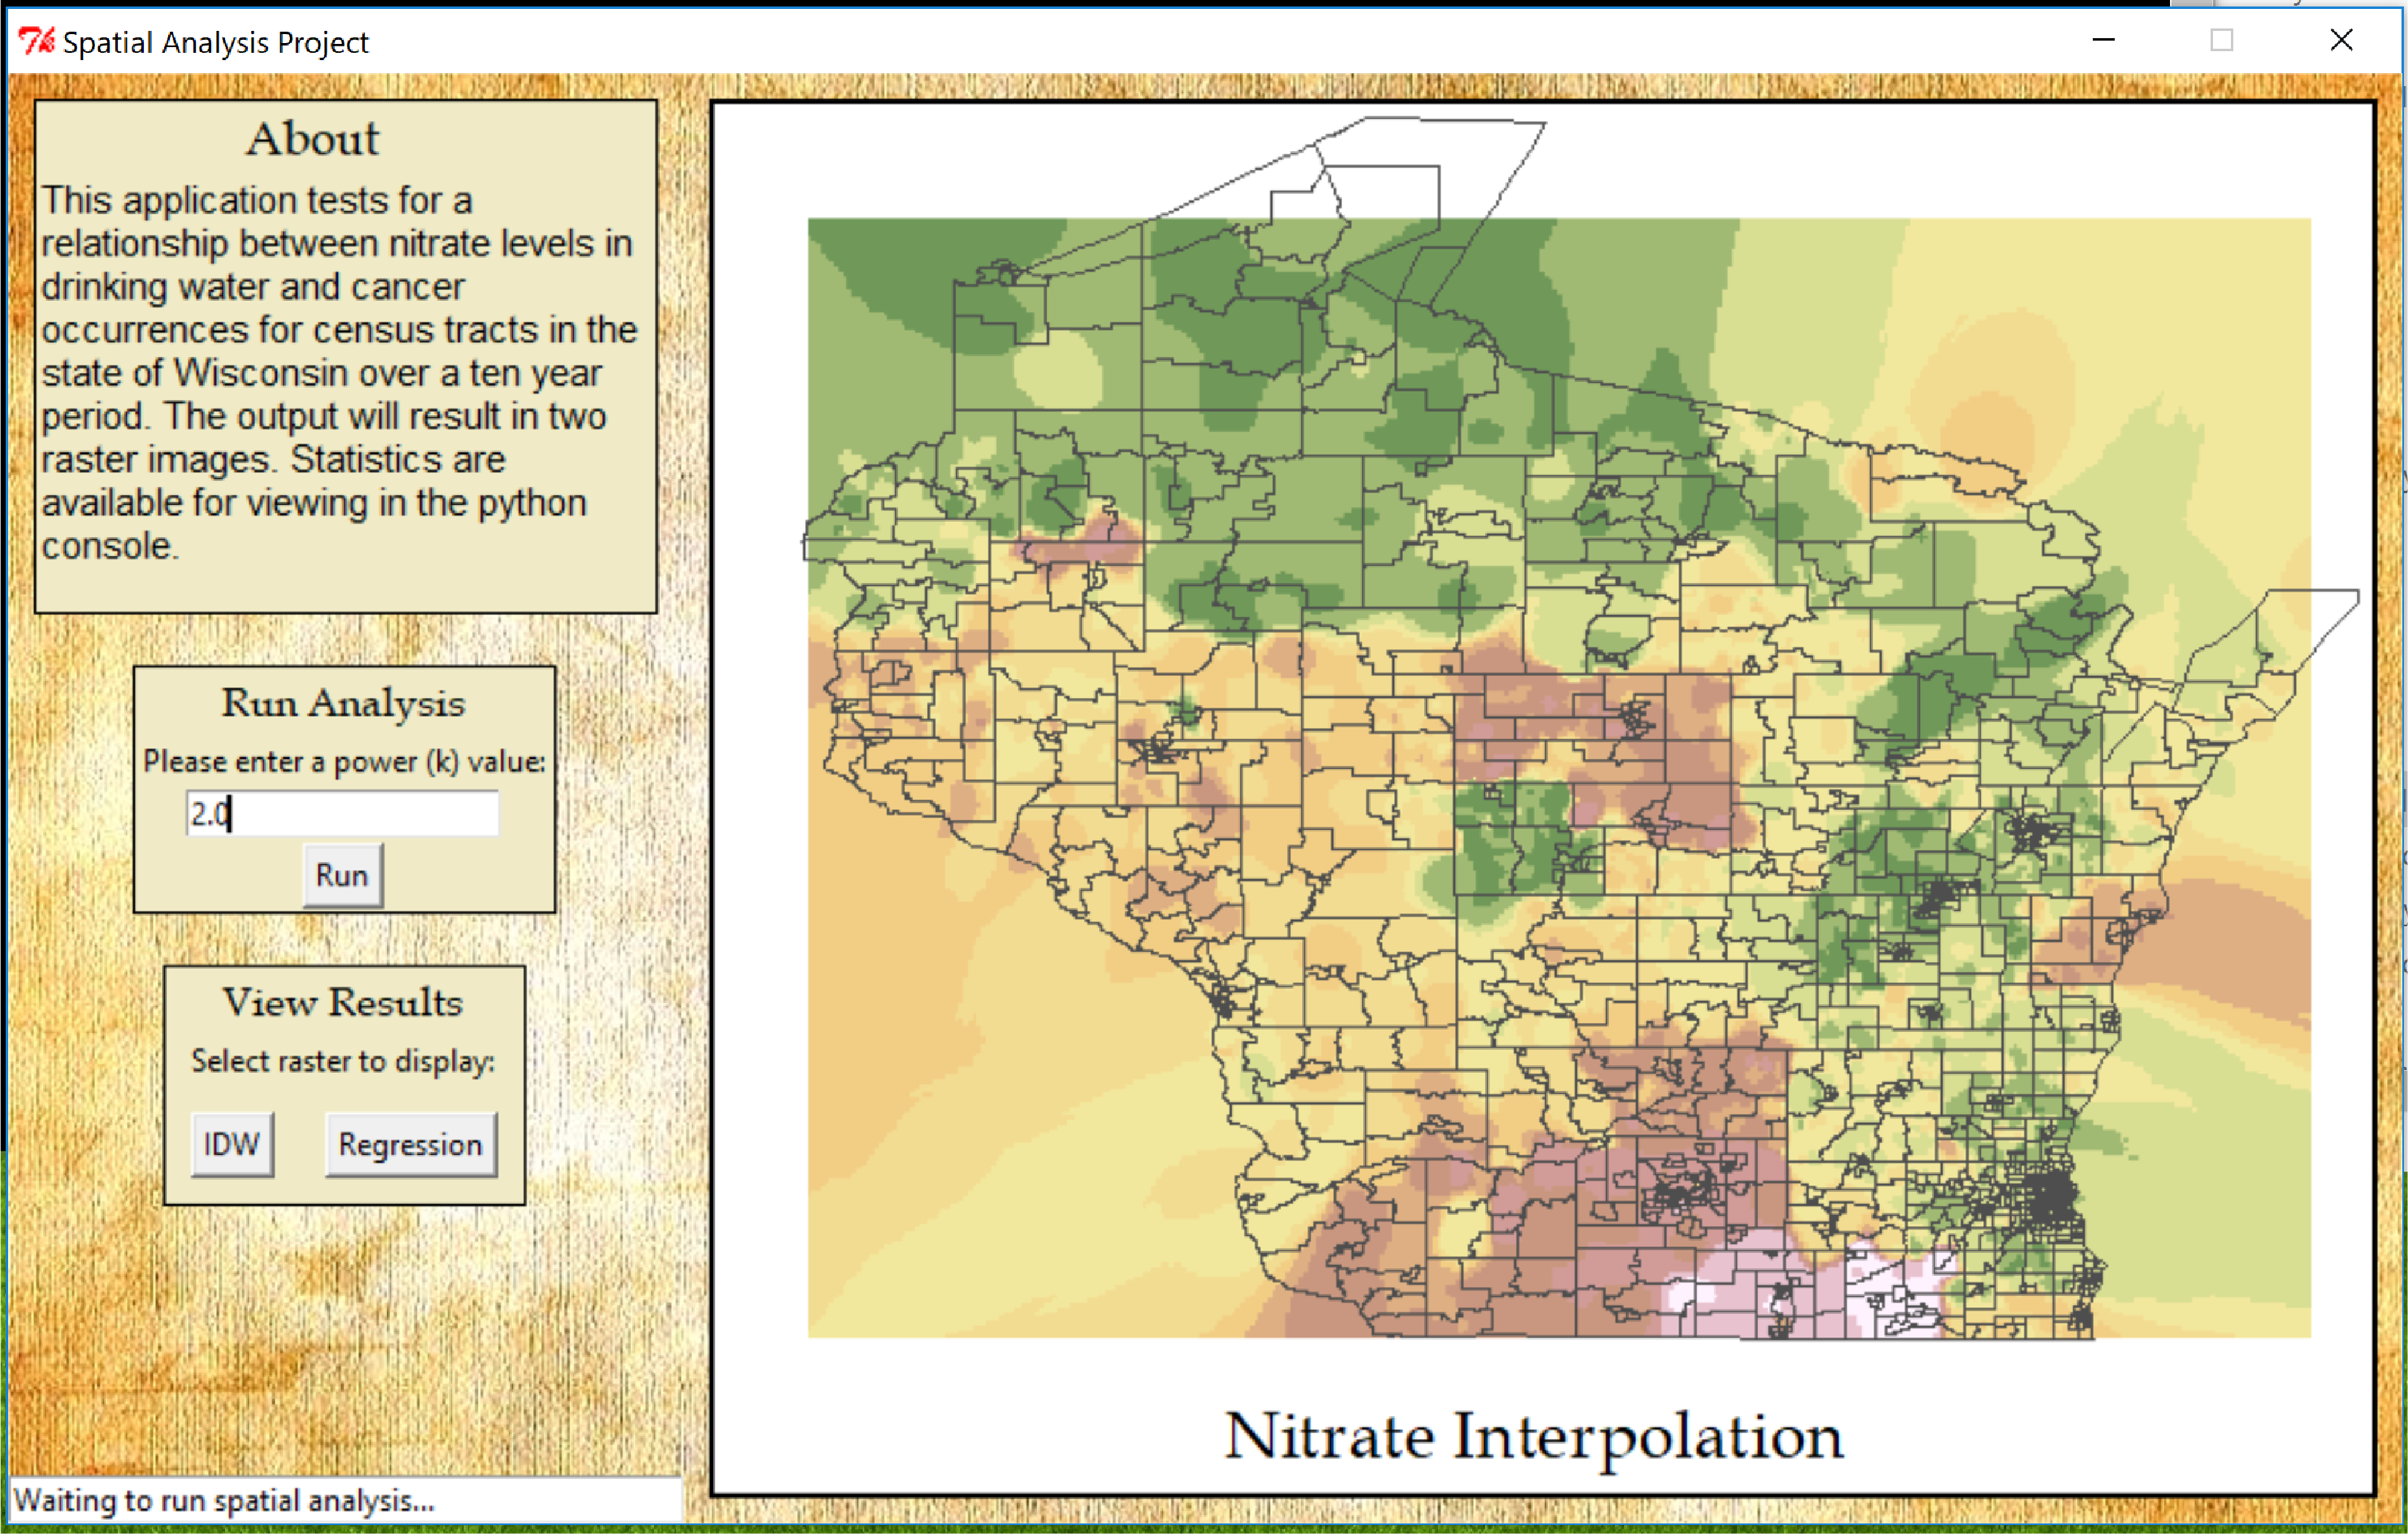
The results of the IDW function show areas in pink with the highest levels of nitrate and areas in green with the lowest levels of nitrate:
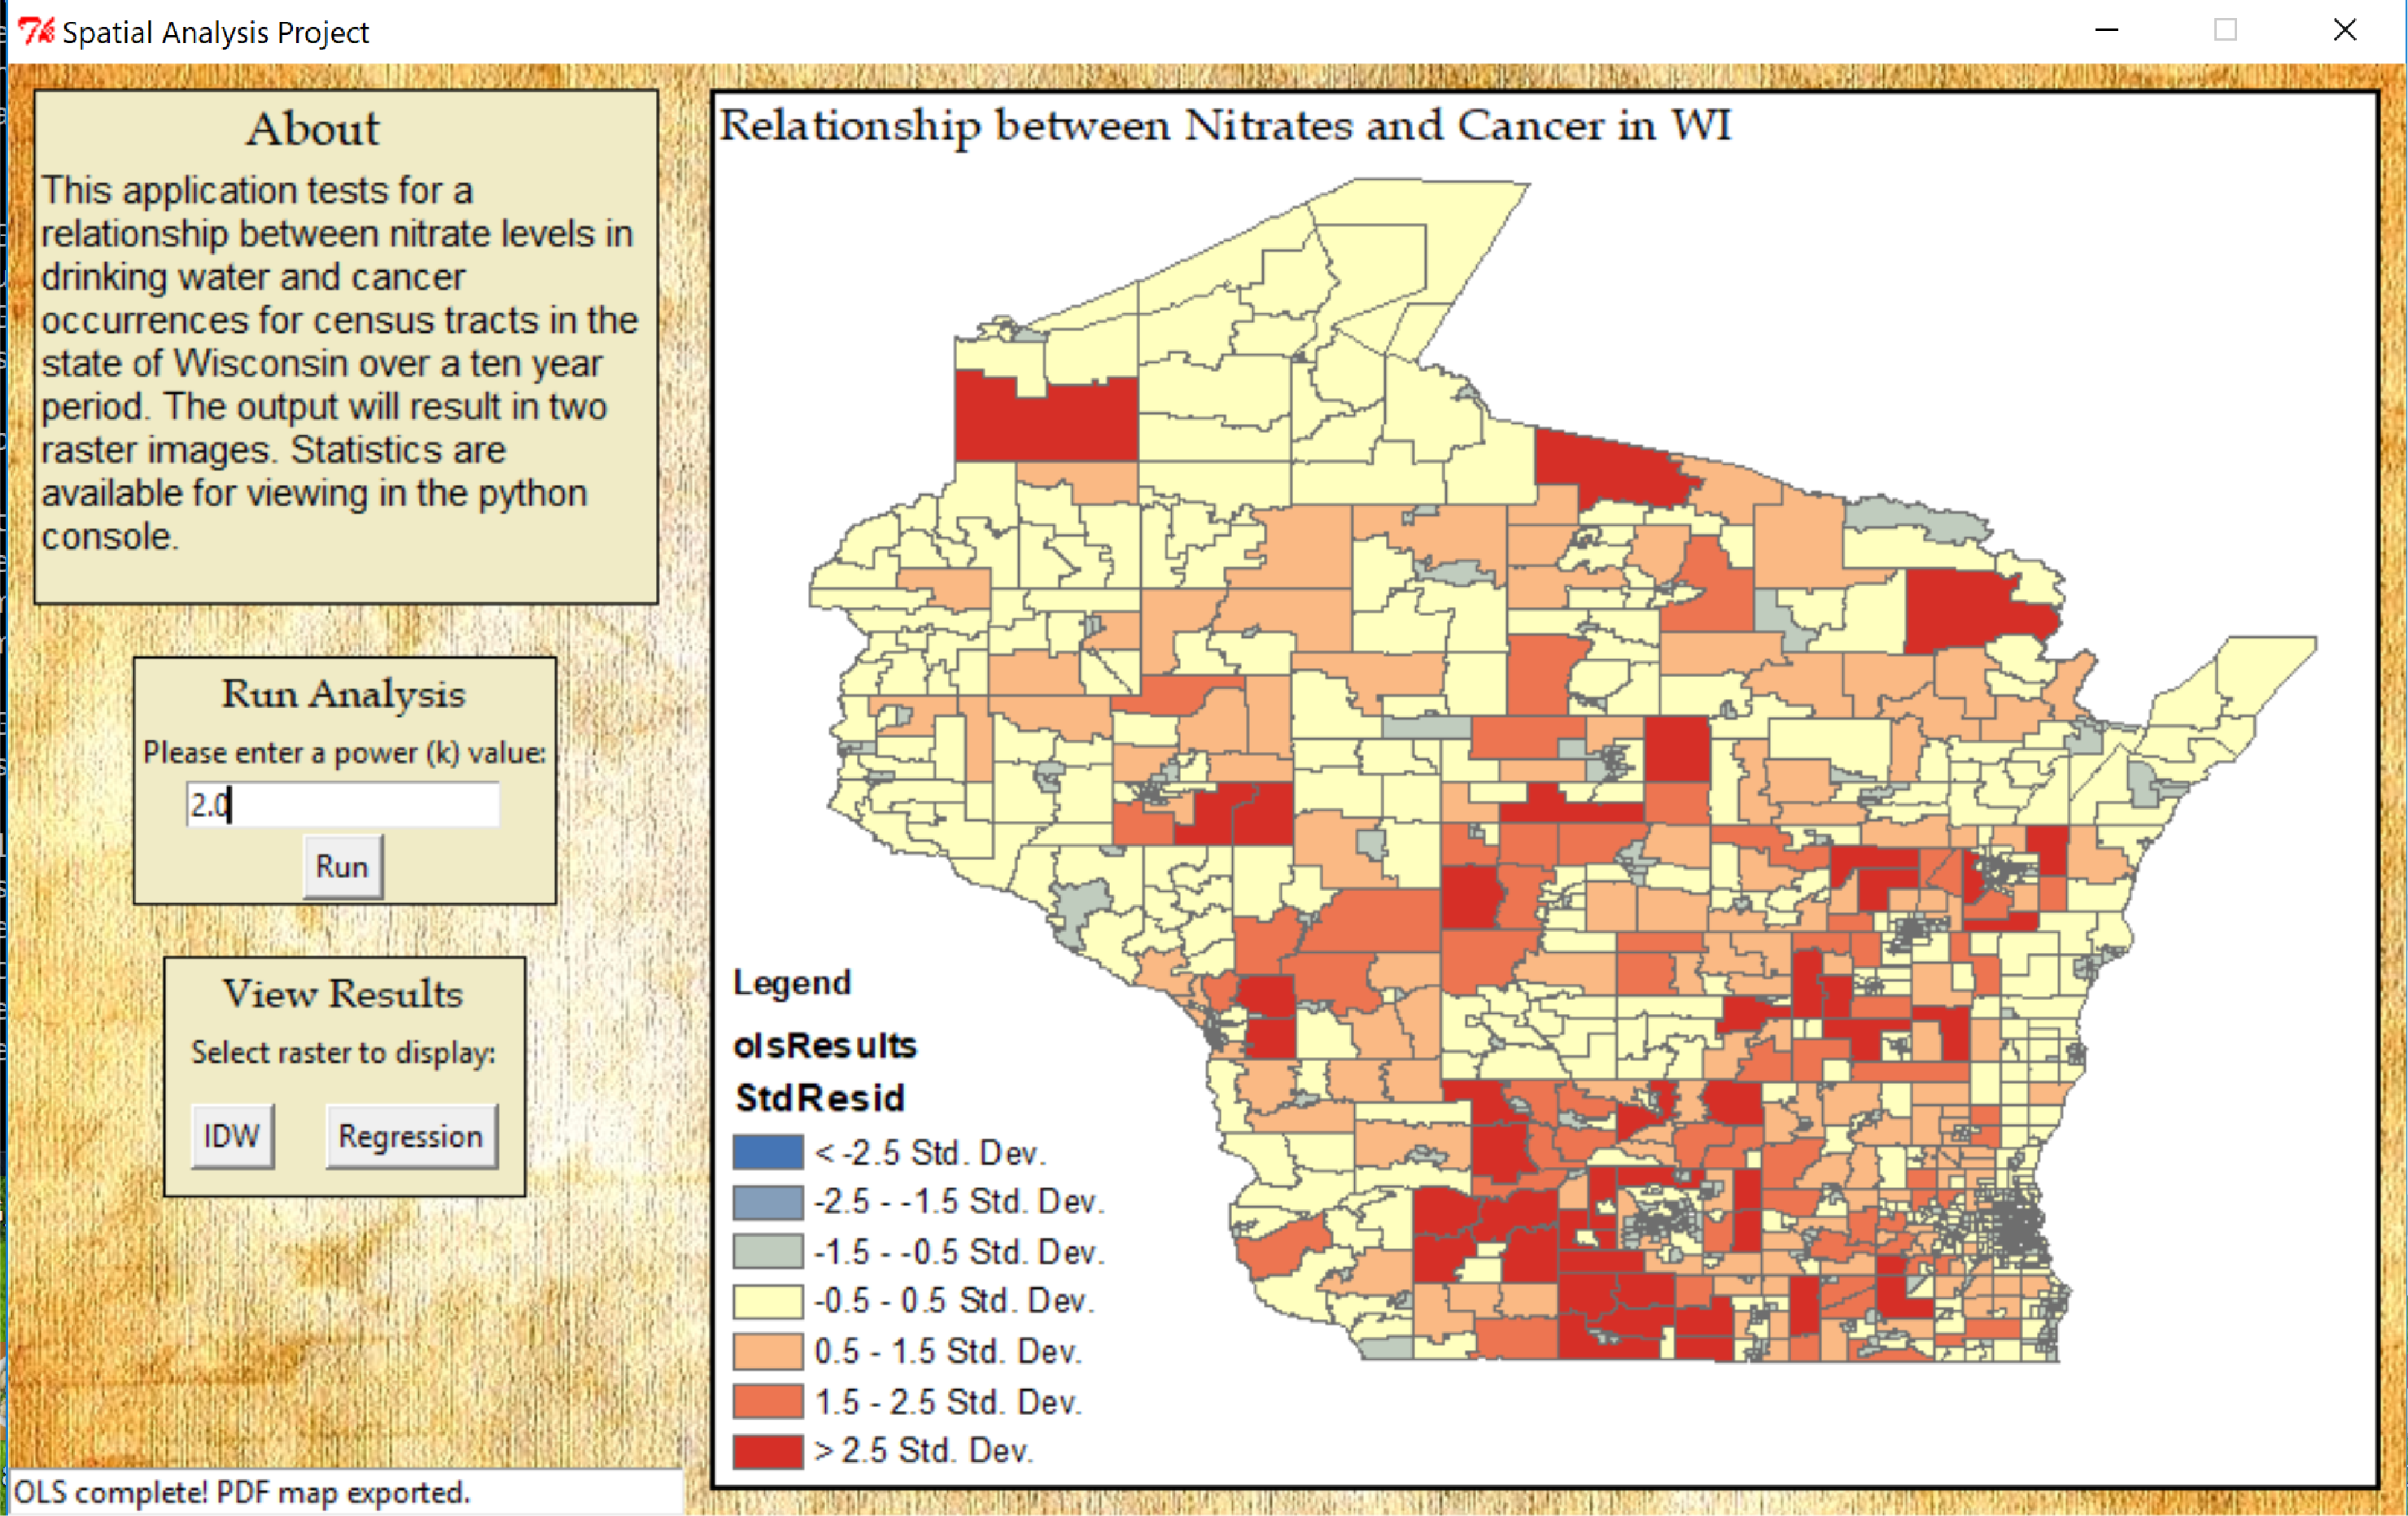
The resulting map for the Ordinary Least Squares regressions displays how well the model performed. When examining the output map over and underpredictions will be randomly distributed for a proper regression model. Clustering of over and underprediction is a sign that one or more explanatory variables is missing. The model shows red areas where the cancer rate was overpredicted and blue areas where the cancer rate was underpredicted. As you can see from the OLS map there are a few clusters of areas where the model overpredicted. Therefore, it can be determining that while the nitrate may have some influence on the cancer rate, other key explanatory variables are missing.

The purpose of this study was to help determine if there was a link between high nitrates in drinking water and cancer occurrences in Wisconsin. A script was written in ArcPy with a graphic user interface to help and assist with the analysis. We have determined that there are one or more key explanatory variables missing in the model. To help determine a link between nitrates and the cancer rate we could use more explanatory variables in the future such as diet and tobacco usage.

